From MoU to Legacy
Sustainability planning. What survives the end of the mandate, who holds it, and how a network converts an expiring agreement into a standing capability.
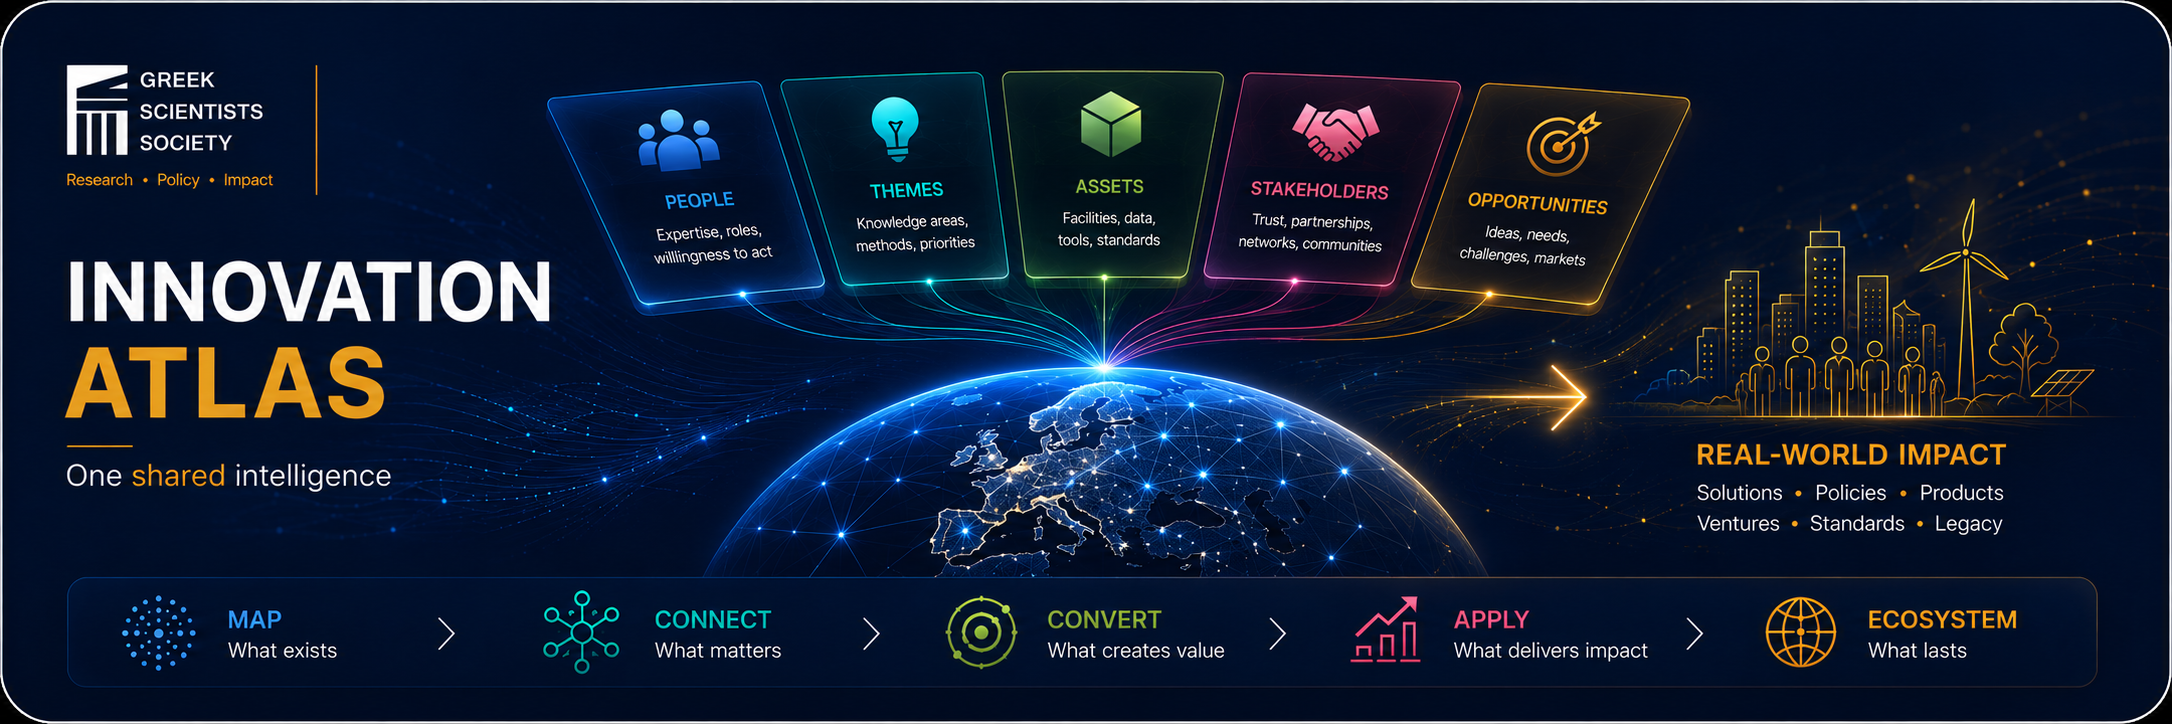
The instrument of the GSS methodology series
The instrument behind the framework: how a research consortium becomes a living innovation ecosystem.
Every funded network already owns more intelligence than it can see. The people are listed, the themes are agreed, the facilities exist, the contacts are in inboxes. What is missing is not effort, it is a structure that makes the network legible to itself.
This framework describes that structure. It is instrument agnostic and domain agnostic: it applies to a COST Action, a Horizon consortium, a doctoral network, a cluster or a learned society. The Innovation Atlas is simply its working form.
The Memorandum of Understanding creates obligations, work packages and a governance chart. None of that produces circulation. Networks that stop at the contract tend to fail in three recognisable ways, and each failure is a mapping failure before it is a management failure.
A roster of names and institutions, accurate on the day it was exported and ageing from that moment. It answers who joined. It is rarely able to answer who can do what, with whom, and by when.
Meetings generate goodwill that is difficult to act on. Capability often sits one degree away from the need it could address, and the adjacency stays invisible because no shared record holds it.
The final report is filed, the website lapses, and the relationships return to private address books. Several years of relational capital are lost simply because they were never held anywhere collective.
A network you cannot query is a network you cannot convert.
In most cases the corrective is not more coordination. It is representation. When a consortium can be consulted by any member, in plain language, along the dimensions that matter to innovation (who, what, where, with which asset, toward which purpose) it tends to behave differently over time. That gradual shift in behaviour, rather than the database itself, is what the word ecosystem is pointing at.
An Action holds four kinds of capital. Three are well described in the intellectual capital literature and can be held directly. The fourth cannot: it is produced only by converting the other three, and it is the one that carries research out of the network and into use.
| Capital | What the network already holds | What the Atlas records | What it converts into |
|---|---|---|---|
| Human | Individual expertise, methods, tacit skill, languages, career stage, willingness to act | People, with declared competencies and roles rather than titles alone | Capacity Teams that can be assembled on demand |
| Structural | Facilities, equipment, datasets, protocols, models, software, standards, training material | Assets, with access conditions and a named custodian | Capability Work that can actually be performed |
| Relational | Trust with policymakers, regulators, agencies and organisations, with industry where relevant, and with the communities specific to the Action: patients, farmers, practitioners, schools, media | Stakeholders, positioned on the helix and on the value chain | Absorption Someone ready to receive the result |
| Innovation | Ideas in progress, prototypes, IP, spin-off intentions, policy openings, unmet needs | Opportunities, with a stage, an owner and a date | Outcome Applications, policies, standards, services that reach people |
The framework treats these as stocks and flows. Mapping measures the stock. Impact is the flow. In most cases a network with high human capital and limited absorption capacity produces excellent literature and little movement beyond it. That is a complete outcome for a research programme and a partial one for a programme asked to deliver societal benefit.
An atlas is not a list, it is a set of layers that share coordinates. Each layer is legible alone and more useful in overlay. Select a layer to raise it.
| Layer | Typical Atlas categories | Query it must answer in one step |
|---|---|---|
| People | Members, working groups, expertise, leadership roles, early career researchers | Find three people in two countries who share a method and are open to a collaboration or a joint grant application. |
| Themes | Research areas, disciplines, technologies, target problems, application contexts | Show every member and asset attached to one theme. |
| Assets | Infrastructures, facilities, datasets, models, protocols, training resources | Show the infrastructures in this region that accept external users. |
| Stakeholders | Industry, agencies and regulators, civil society and end users, media and education | Show the non academic actors on this value chain segment and who owns each relationship. |
| Opportunities | Emerging innovations, IP and patents, R&D pipeline, spin-offs, policy briefs, mobility | Show what is at prototype stage and what competence it is missing. |
The layer model is deliberately thin. Any Atlas with more than five top level categories should be able to fold them into these five without residue. Where a category will not fold, it is usually an output record (papers, events, deliverables), which belongs with the reporting record rather than on the map.
The helix is usually drawn as four interlocking bands and left there. To make it operational, each actor needs three coordinates: which helix, where on the value chain, and who inside the network holds the relationship.
| Helix | Who this includes | What they can give the network | What they need from it |
|---|---|---|---|
| Academia | Universities, institutes, learned societies, doctoral schools, adjacent networks and Actions | Method, validation, talent pipeline, co-authorship, access to further consortia | Problems worth studying, data, joint supervision, visibility |
| Industry | SMEs, large firms, producers, technology providers, clusters, investors, incubators | Real constraints, scale-up capacity, co-funding, route to market, testing environments | De-risked technology, evidence, standards, trained people |
| Government | Ministries, agencies, regulators, standards bodies, regional authorities, funders | Legitimacy, regulatory pathways, procurement, follow-on funding, uptake at scale | Evidence in usable form, timing aligned to policy windows, a single credible interlocutor |
| Society | End users, patients, farmers, practitioners, NGOs, schools, media, citizen science groups | Definition of what matters, field data, adoption, social licence, communication reach | Plain language, participation on their terms, results that return to them |
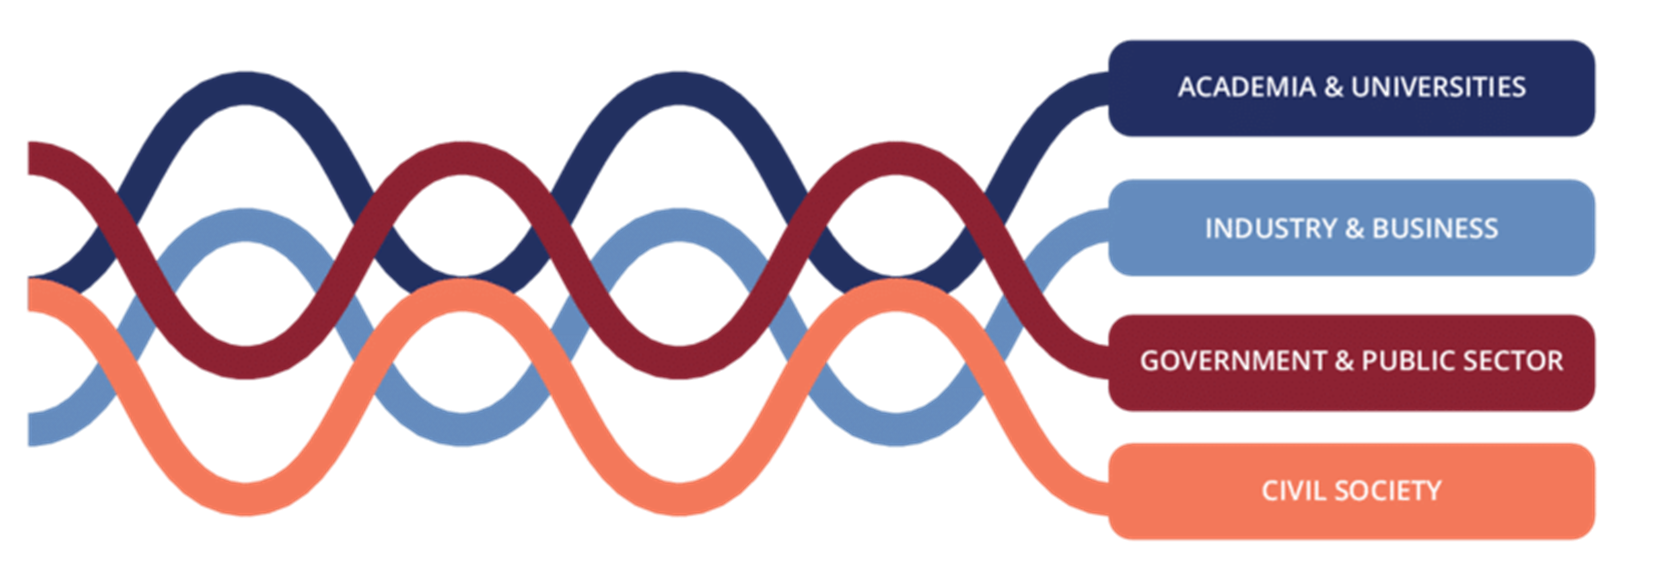
The triple helix model described the interplay of universities, industry and government. The quadruple helix adds the public: media based and culture based communities, civil society and the people who live with the results.
Carayannis, E. G. and Campbell, D. F. J. Quadruple and quintuple helix innovation systems. Reference retained here for the concept, not for the diagram.
Every entry carries the name of a member who holds the relationship. Entries without an owner are set aside at each review. In most cases this one rule is what keeps a stakeholder map from settling into a mailing list.
Record the state of each relationship: identified, contacted, engaged, collaborating, co-investing. Progress is movement between states, and it is reportable without inventing metrics.
Place the actor in the chain of use first (evidence, practice, provision, regulation, adoption). Position suggests what is worth offering them. The category alone rarely does.
Mapping is necessary and inert. Conversion is what the coordinator, the working group leaders and the innovation manager actually do with the map. Each move has an owner and a rhythm.
Make the invisible countable. Pull scattered expertise into one queryable surface so the network can see its own mass.
Who do we have, and what can they do?
Find the unlikely pair. Combinations across themes and countries are where novelty lives, and they are invisible without overlay.
Which two capabilities have never met?
Attach a receiver to every promising result before it exists. A finding with no named absorber will not travel further than a journal.
Who is waiting for this, and in what form?
Put a date, an owner and an instrument on it: a short mobility, a joint proposal, a policy brief, a licence, a spin-off, a standard.
What happens next, and by when?
The four moves are a cycle, not a funnel. A network in steady state runs all four continuously, and the Atlas is the shared memory that lets a new working group leader pick up the cycle without inheriting anyone's inbox.
This is a suggested sequence rather than a prescription, and the order tends to matter more than the pace. Enrichment attempted before a baseline exists usually returns low response rates. Activation attempted before enrichment produces matches members have little reason to trust. Legacy planning left to the final year tends to produce a website that lapses.
For a new Action the four stages sit comfortably one per grant period. For an Action already running, stages 01 and 02 can be compressed into a few months, since the roster, the working groups and much of the vocabulary already exist, and stage 03 can begin in the same period. Stages 01 to 03 put From Mapping to Impact into practice (also available as a PDF). Stage 04 continues in From MoU to Legacy, which sets out the seven steps from mapping through co-development to institutional embedding, and the output each one is expected to produce.
Harvest what already exists rather than asking members for anything. Everything in this phase can be assembled from documents the network already produced.
Convert the roster into declared capability. Ask members to correct their own record, which is a far lighter request than asking them to create one.
Use the map in every routine decision until using it becomes the default. Adoption comes from consequence, not from communication.
Decide who holds the map after the funding ends, while the funding still exists. This is the point at which the framework hands over to the sustainability method.
Each level is diagnosed by observable behaviour, not by the software in use. Most networks sit at level one and describe themselves as level three.
A list of names and institutions exists for reporting purposes. It is seldom consulted when a decision has to be made.
Profiles exist and can be browsed. Searching returns people, not capabilities, and the record ages between reports.
Themes, assets and stakeholders are recorded against a shared vocabulary. Cross-cutting questions can be answered in one step.
Plates overlay. Adjacencies become visible, opportunities carry owners and dates, and the map informs how resources are allocated.
Members use the instrument without being asked, external actors request entry, and the map keeps working after the mandate that created it has ended.
| Family | What it measures | Examples |
|---|---|---|
| Capacity | How much intelligence is visible | Enriched profiles as a share of members, countries with declared assets, vocabulary terms with more than one claimant |
| Connectivity | How much of it is in contact | Cross-country and cross-theme pairs formed, assets used outside the host institution, stakeholders with a named owner |
| Conversion | What became something else | Opportunities that changed stage, proposals submitted by teams first assembled through the map, policy or industry uptake events |
Report conversion sparingly and honestly. Three traced conversions with named owners are more persuasive to a reviewer, and more useful to the network, than forty counted interactions.
A stakeholder map holds information about people, some of it contributed by others on their behalf. Trust is the operating requirement here, and it is far easier to keep than to rebuild.
Public fields are contributed by the person they describe, recorded with a date, and removable on request. Personal contact details stay behind access control by default, and records that carry commercially sensitive content are restricted rather than open. These are the conditions the framework asks for, in line with GDPR principles. Any deployment should confirm its own legal basis with its host institution.
Content arrives in one of three ways: contributed by the person or institution it concerns, suggested by another member, or drawn from a public document. Suggestions and contributions are reviewed by a moderator before they appear, and the source is kept with the record so that a later reader can see where it came from.
One person maintains the map, working with a designated contact from the Action who knows the network from the inside. Continuity of access between grant periods is part of the arrangement, so that updates do not depend on a single meeting or a single term of office.
Two further disciplines matter more than they sound. Keep the vocabulary under editorial control, with one person able to decline new terms so that the taxonomy stays usable. And version the whole map at least once a year, so that a claim made in a report can be checked against the state of the map on the day the claim was made.
The framework was built by doing it. The reference deployment maps a European aquaculture network across seven public categories, one controlled taxonomy and six ways of reading the same records. Figures below are a snapshot of that deployment, not a target for anyone else.
Draft deployment. The figures below are a snapshot of a live build and will change. They are shown to illustrate proportions between the layers, not as a benchmark for any other Action.
Categories as published, with the layer each one belongs to
Seven categories, five layers. Knowledge and application context are two faces of the same disciplinary layer: what the network knows, and where that knowledge is applied. Outputs and events (media and dissemination on one side, meetings and mobility on the other) sit deliberately outside the map. They record what the Action has produced and reported, while the five layers record what it is able to do next.
Not every record is open. Entries that carry protected or commercially sensitive content, patents in particular, are visible in outline and restricted in detail, so that the existence of a result can be discovered without exposing what should not be public. This is why an open view shows fewer entries than the total.
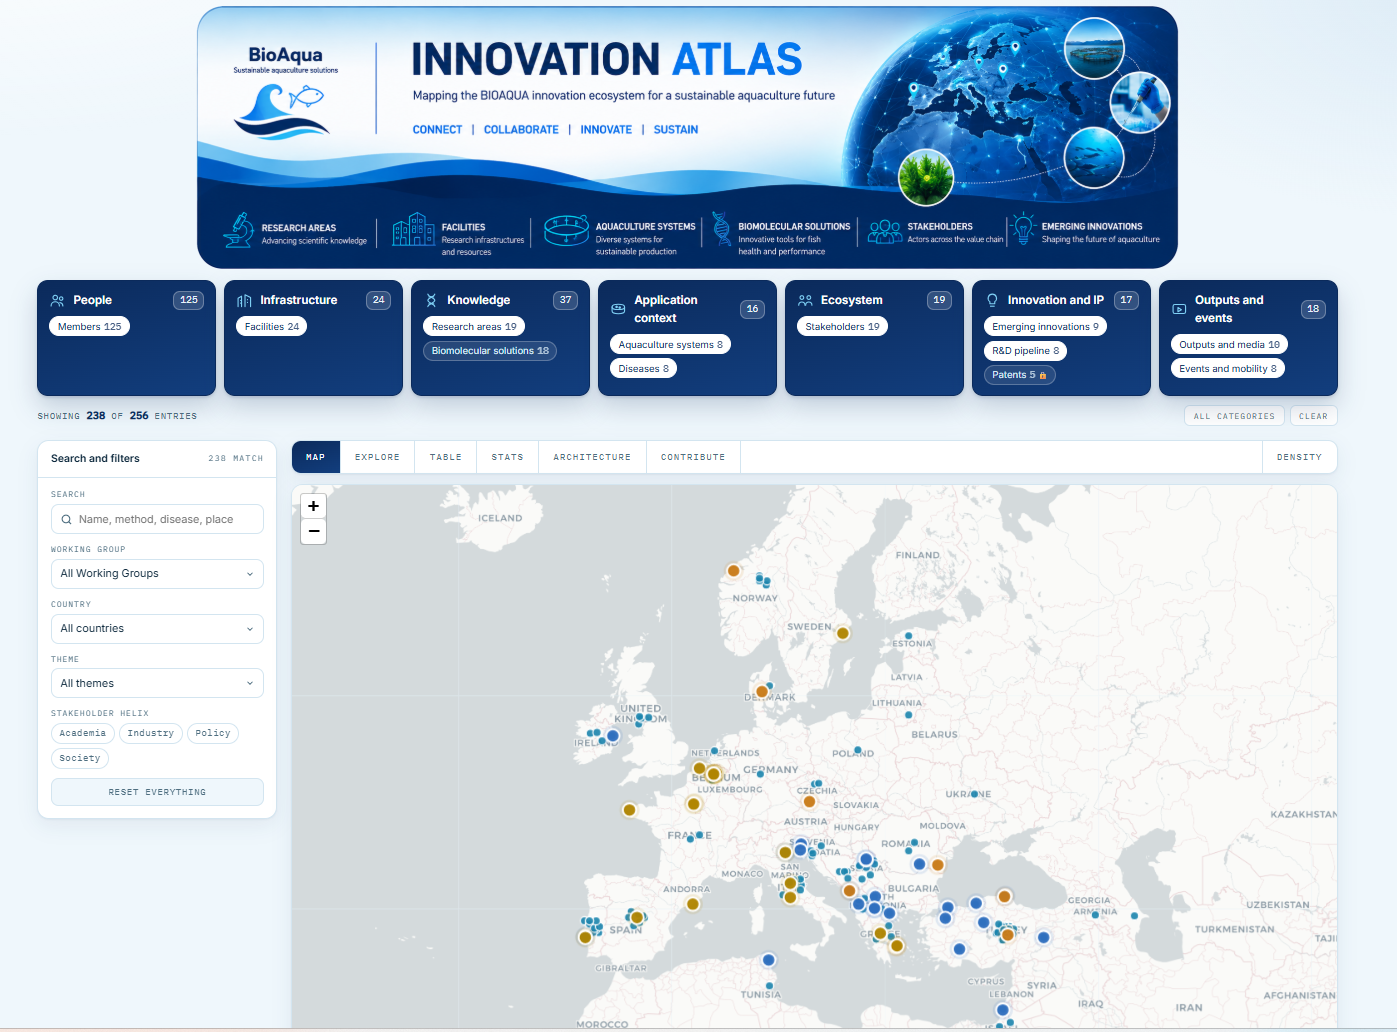
Where capability physically sits, with density by country and region.
Faceted browsing by working group, country and theme, for members who do not know what they are looking for yet.
The full record, sortable and exportable, for coordinators preparing a report or a proposal.
Coverage and gaps, which is where the network can see for itself where it is thin.
The taxonomy and data model made public, so the structure can be audited and reused.
The enrichment route. Members correct their own record rather than the coordinator chasing them.
Three published components address three different questions. They can be adopted separately and tend to work best in sequence. Further work is under way.
Sustainability planning. What survives the end of the mandate, who holds it, and how a network converts an expiring agreement into a standing capability.
Strategic stakeholder framework. How the intelligence held by a consortium is made visible, positioned on the helix, and converted into outcomes.
The working form of the framework: five layers over one taxonomy, deployable for any Action, with the same architecture across cohorts and domains. The first deployment is documented in section 09.
A framework describing the exchange itself, what happens once a map shows that a capability in one country and a need in another have not yet met, together with an operational approach for running this across several Actions. Neither is published yet.
The step after the instrument
One Atlas serves one network. Many Atlases on one architecture would begin to behave as a single ecosystem: adjacent Actions able to find each other, capability visible wherever it sits, and the conversion moves running between networks rather than inside one.
Adjacent is the operative word. Actions working the same problem from different disciplines rarely meet, because nothing tells them they are neighbours. A shared architecture would.
What that asks of each Action is small: a common minimum record, a published vocabulary crosswalk, clarity on what may be read across boundaries.
The aim is to support European science in finding its place in a global setting, and the Atlases are a first step toward it. An ecosystem is built one connected map at a time. That is the direction of the work, rather than a description of where it stands today.